Effectiveness of Lockdowns: A review.
- rcheungkm
- Feb 6, 2022
- 12 min read

Updated: Sep 11, 2022
Looking back at what has transpired in the past two years, I cannot fathom the astronomical failure of our Canadian government to properly respond to the pandemic. Handing over their reigns and responsibility to public health to make decisions on behalf of all citizens in Canada. Regurgitating the words of “Follow the science” and yet, when we did, it contradicted their policies that were implemented.
I am writing this review today to examine the impact of lockdowns as part of the Canadian government’s non-pharmaceutical interventions (NPI) in response to the novel Covid-19 virus (Sars-CoV-2). This will be the first part of looking at the different NPIs implemented during the pandemic. I will try to be as comprehensive as possible and clear in my analysis of the studies being looked at.
Why did the government decide to implement lockdowns?
Countries around the world were faced with a pandemic situation as Sars-CoV-2 started to spread very quickly. Canada and many other countries decided to implement lockdowns as part of their NPI strategy to restrict movement by shutting down non-essential businesses and keeping essential businesses open in the attempt to reduce transmission, mortality, and morbidity, and to prevent hospitals from being overwhelmed. [1]
The decision to implement lockdowns was based on several studies that examined the effects of lockdowns on suppressing and mitigating the virus, but also the feasibility of the strategy; one of these studies was by Niel M Ferguson at Imperial College. In this study, the authors used a susceptible, infectious, or recovered model (SIRs Model) to estimate effects of using lockdowns on mortality and ICU beds being occupied in comparison to several counterfactuals. [2][3]
In reference to Figure 1, taken from the study, we can see that the SIRs model estimated total deaths for Great Britain (GB) and United States of America (US) to be 510,000 and 2,200,000, respectively. [2] In a statement after this study was published, Ferguson and his team published revised estimates for other countries such as: Canada, UK, Sweden, Korea, Japan, and Taiwan. These can be seen in Table 1.
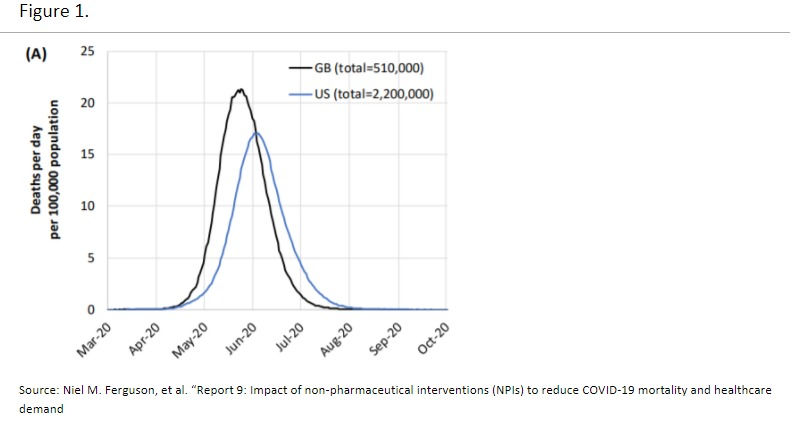

As you can see in Figure 1, the SIRs model predicted deaths would reach a peak of 510,000 deaths in Great Britain and 2.2 million in the US by May 2020 if they did not heed their suggestions for lockdowns. In reference to Table 1, you can further see the projections for other countries with and without lockdowns. [4][5][6] In the 4th column you can see what actually happened and the predictions were drastically wrong. Even after 1 year into the pandemic, the predicted mortalities were never reached.
What are some plausible explanations for this happening?
In a critical review by Douglas W. Allen from Simon Fraser University, he stated that the SIRs models' main goal is to reduce the basic reproduction number (Rt). The Rt refers to the number of secondary infections from an infected individual in a susceptible population. [3][7] The Rt number is one of the most important considerations in the model because it is a metric that describes the transmissibility of the virus.[8] Consequently, the suggestive method in reducing Rt is to introduce lockdowns, therefore in theory, it would reduce mortality rates and hospitalizations.
However, when the SIRs model predicted deaths with and without lockdowns, it massively missed the mark. Several authors have delineated this predicament due to multiple factors such as: biological, socio-behavioral, and environmental that affects the Rt.[8][9][10] This means there could be a plethora of reasons why estimating Rt from mathematical calculations might be wrong such as exogenous behavior of humans. These models assume that there are no other adaptations society would enact in the face of the virus such as voluntary isolation, adopting hygiene strategies, other NPI policies, more. Additionally, the input values for the estimations of Rt are chosen by the modeler.[8]
Furthermore, Douglas W. Allen criticized the inadequacy of the SIRs model to determine the number of beds occupied in ICU because these counterfactuals assume that the population does absolutely nothing in decreasing transmission of disease or increase hospital bed capacity. In comparison to a lockdown strategy, these differences are exaggerated. [3] Refer to Figure 2.

Therefore, the model proposed by Ferguson et al. failed because the Rt number was too high (2.4), infection fatality rate (IFR) was too high (0.9%), alongside the mentioned problems of behavioral, socio-behavioral, and environmental factors.
In another study, one researcher tried applying a SIRs model using data from the beginning three months of the pandemic in Isfahan using 3 different scenarios based on social distancing stringency (lockdowns). The SIRs model successfully matched the predicted values to actual data in the next six consecutive months. However, the model failed after 6 months because it was unable to predict the second wave that happened in July. [7] Once again, the authors noted that main reasons for this is because of behavioral changes in relation to social and cultural context of the specific population being examined.
As mentioned before in the Ferguson et al. Study, lockdowns are meant to reduce transmission by limiting contact and movement. Was this representative in reality? It is hard to determine because of many confounding, however we can still review some of the literature to see what we can pick at. Several studies have attempted to determine whether movement/mobility had been decreased using google mobility data. In one study, mobility data was gathered across all 50 states in US from February 24th + 100 days (refer to Figure 3). The dashed lines represent the time when lockdowns were implemented, and the dotted line represents when lockdowns were lifted. [9]

According to the data presented by the mobility data, the authors report that mobility decreased for several weeks before the lockdowns were implemented. This means that nation-wide mobility was already decreasing because of other reasons, and there could be many.[9] For example, the news of a new novel coronavirus spreading quickly across the globe causing mortalities and hospitalization could cause citizens to adopt behaviors that would distance or isolate themselves from others. An interesting note that the authors presented was that the news about lockdowns that would be implemented may have already caused businesses to incorporate work from home procedures and thus, already reducing mobility and contact.[9] However, the authors determined that the lockdowns had insignificant effect on overall mobility, only accounting for 0.7% of decrease in mobility, given that 50% of mobility was decreased between February and April. Comparable results were seen in a study determining changes in mobility before and after lockdown in Bogota, Columbia; mobility was already decreasing prior to lockdown implementation. However, they delineated those lower socioeconomic zones have lower mobility reductions prior and during lockdowns in comparison to higher socioeconomic zones.[11] This could be due to several reasons such as employment where they cannot work from home and must travel to work.
In one study that looked at 5 different regions in Greater Toronto Area (GTA) in Canada (Durham, Halton, Peel, Toronto, and York), they compared Rt, mobility, and cases from February 2020 to April 2021. Figure 4 depicts changes in Rt and mobility throughout the timeline. The 5 different colors indicate distinct stages of lockdown that were implemented. Interestingly, as the authors noted, the highest decrease in mobility was noticed during the first two weeks of the lockdown, but this trend was already happening prior to the lockdown. As well, Rt decreased during this time and similarly decreased and increased according to lower mobility and higher mobility, respectively. [12] [13]


However, all 5 regions show slight changes in mobility throughout the various stages of lockdown, which would indicate that the mandatory lockdowns may not have had the desired outcome. In addition, the study did try to look at cases as well and the authors noted that cases, Rt, and mobility had “little clear indication that these policies altered existing secular trends.” [12] This is because there are many confounding such as: other NPIs that were put into place at the same time as lockdowns with social distancing, hygiene, and masks. It is hard to isolate one NPI and determine which one had more of an effect. As well, cases were low in the summer and high in winter which could relate more to seasonal changes and virus transmission rather than mobility. [12]
Likewise, one study examined the different targeted lockdowns in Ontario as some regions had shorter or longer stages of lockdown and inter-region mobility. More specifically, they looked at mobility during stage 2 lockdown measures in June and stage three between July and August, and the beginning of the second lockdown in November.[13] From their analysis on outflow data from mobility phone tracking, the targeted lockdowns n Ontario had no effect on inter-region mobility. This invalidates the notion that people from more stringent stages of lockdowns would travel to less stringent stages of lockdown. This corroborates with the previous study that lockdowns had insignificant effect on overall mobility of Canadian citizens.
Moreover, in a working paper out of Harvard, they determined that 2 weeks after the first initial lockdowns that had been implemented in 152 countries, it does have a significant effect on the transmission of the virus and death toll. However, there is a diminishing return of effect on the spread of the virus and death toll after the first 2 weeks and 120 days (about 4 months) into strict lockdowns, has an insignificant effect on Sars-CoV-2 deaths and Rt. [14]
Still, there are several contrasting studies that have determined lockdowns as being successful based on the benefits it provided in reducing mobility and transmission. [16-21] Some of these studies have many limitations as they only indicate the reduction in mobility from lockdowns and inferring that it reduces transmission. As well, the studies that do infer a reduction transmission demonstrate a correlation with a reduction in cases. For example, in a study examining strict lockdown effects in South Africa, the authors determined that the measures taken in place did indeed reduce mobility, transmission, and cases but did not mention mortalities.[22]
However, in a review article by Ari R. Joffe and David Redman, research papers that supported lockdowns in reducing transmission, cases, mortalities, morbidities, and reduction in burden on hospitals, were resulted in confounding and modelling errors.[23] In many studies that were critical of the investigations into lockdowns and their efficacy claimed that endogenous behaviors were the likelier cause of reduction in transmission and mobility. As well, models that did support lockdowns were refuted by many studies that determined flawed and circular methodologies and did not account for confoundings.
So far, the studies that have been reviewed have only examined transmission and mobility (only briefly mentioned one study where there was a diminishing effect of lockdown and death toll). Another important aspect of the lockdowns was that it would reduce transmission and therefore, reduce mortality. In the beginning of this review, we determined that the SIRs model failed to model the trajectory of the pandemic and overestimated death tolls by an astounding amount. Now let’s look at some studies and data to compare stringency of different lockdowns in country in comparison to the death toll. In theory, the stricter lockdowns should represent smaller death counts and less strict lockdowns should represent a higher death count due to COVID-19.
Using the stringency index from OurWorldinData, it calculates the stringency of lockdown measures imposed by countries based on nine response metrics: workplace closures, cancellation of public events, restrictions on public gatherings, closures of public transport, stay-in-place/home requirements, public information campaigns, restrictions on internal movement, and international travel controls.[23] The higher the score, the more stringent lockdown policies were in place, and lower the score, less stringent.
Referring to Table 2 is the stringency index of 7 countries that were examined in the beginning of the review, as well as the cumulative death after 1 year into the pandemic. Table 3 is the top 10 countries with the most stringent lockdown policies in place after 1 year into the pandemic and their cumulative deaths.

According to the data, it does not seem there is a consistency in relation to the stringency of lockdowns and their representative cumulative mortalities due to Sars-CoV-2. Palestine and Germany had the same SI but had different cumulative deaths of 1,936 and 65,288, respectively. Even when you compare Lebanon (92.59 SI) to Great Britain (87,96), they have an enormous difference in cumulative deaths of 4,037 and 117,481 deaths, respectively. Japan with a lower SI of 49.54 had 7,043 deaths in comparison to the US, with a higher SI of 71.76 with 487, 848 deaths.
If one of the goals of lockdowns was to reduce mortality, we would see a stark difference in cumulative deaths due to covid in comparing the most stringent lockdown countries to the least stringent lockdown countries. Even when we take total population into account, Great Britain (67,886,011 total population) and South Korea (51,269,185 total population) had vastly different outcomes of 117,481 deaths and 1,534, respectively. In fact, some may argue that geographical size of the country may also play a role in the transmission of the virus and thus affecting total mortality. However, it does not seem to be the case as the US is by far the largest out of the countries that we have examined but had the most cumulative deaths; As well, Britain geographically is twice the size of South Korea but experienced even more deaths. What the information here tells me is that these factors may not play as big of a role in understanding the transmission of a virus. There could be many more factors that affect respiratory illnesses like Sars-Cov-2 such as environmental (seasonality, temperature, humidity, precipitation, air quality, airflow, pollution) [24][25], genomic structure, susceptible populations (age, comorbidities, underlying health conditions, etc.) [26], demographics (lower socioeconomic areas vs higher socioeconomic areas), and individual behavior. There are a lot more factors that I have not accounted for, but already you have an idea of the plethora of factors affecting transmissibility of a virus.
Just to dabble a bit, a couple of studies can illuminate how seasonality can affect the outcomes of a respiratory virus. For example, according to the CDC, the US experiences flu seasons in fall and winter where activity of the virus is at its peak affecting transmissibility, hospitalizations, and deaths. [27] This is because seasonality of influenza virus favors climates where proper humidity and temperature can be reached at in cold and dry climates and humid and rainy climate when precipitation is at its highest.[28] In fact, susceptibility of an individual to respiratory viruses is increased during colder weather because it decreases immune response: downregulation of immune cascade, reduced Natural Killer (NK) cell count, cytolytic activity, and lymphocyte proliferation.[29] For example, during cold and dry season, people have an impaired mucociliary clearance of foreign invaders which increases chances of infectivity. [27] There is even evidence to suggest that humidity also affects the droplet size which can affect its ability to stay in the air long enough for a susceptible individual or drop to the ground. One notable factor of the Sars-Cov-2 virus is that it is both an aerosol and airborne disease varying in sizes. [30] In fact, one study modeled the seasonal oscillations of 5 countries in the northern hemisphere and 5 countries in the southern hemisphere and found that there were similarities to number of cases and deaths (Refer to Figure 5). [25] They determined that infectivity and mortalities were stronger in climates that were colder. Also noting that environmental conditions affect viability of the virus, as well as physiology and behavior of an individual.[25]. For example, during colder seasons, people are more likely to stay indoors, which increases social contact, closeness, and therefore more susceptibility to infection. This is corroborated with other studies that have linked seasonal changes to mortality rates. [31-33]

Moreover, a growing number of studies are shedding light on how pollution might be linked to COVID-19 health outcomes. In particular, one study examined Sars-CoV-2 mortality rates regressed against air pollution concentrations (PM25) at an area level across the US.[34] According to the New York Department of Health, PM25 are fine particles or droplets that are 2.5 microns or less in size. Exposure to such fine particles is suggested to have negative health consequences such as asthma and heart disease, chronic bronchitis, reduced lung function and mortality from lung cancer and heart disease.[35] To quote from the authors of the study, they found that “an increase of 1 μg/m3 in the long-term average PM25 is associated with statistically significant 11% (95% CI, 6 to 17%) increase in a country’s COVID-19 mortality rate; this association continues to be stable as more data accumulates.” [34] Although these are preliminary studies with several limitations, this gives us an insight on how even pollution can affect the mortality due to Sars-CoV-2.
Historically, coronaviruses have a strong and predictability pattern in accordance with seasonality. If Sars-CoV-2 has a strong link with seasonality (which needs to be further examined but current evidence is demonstrating a strong relationship), lockdowns are not effective in containing the virus as we have never done so for previous coronaviruses. [36]
Although we are only in year 2 of the pandemic, further research in the future should delineate how much of a total effect does lockdown play a role in the decrease in transmission of Sars-CoV-2 in comparison to the multitude of factors that affect transmission. One recent meta-analysis on the effects of Sars-CoV-2 and lockdowns showed that it reduced COVID-19 mortality by only 0.2% in Europe and US and shelter-in-place (SIP) orders only by 2.9%. [37] Further, they determined that closing businesses may have had the most effect, of only 10.6% in mortality. The authors also note that other NPI’s such as mandating mask usage are underwhelming as the evidence is controversial at best. In fact, there is a meta-analysis out of the CATO Institute by 3 authors delineating that “ Taken as a whole, the available mechanistic and clinical evidence leaves substantial uncertainty as to whether, to what extent, and under what circumstances community-wide use of cloth face masks helps to reduce infection rates of Sars-CoV-2" (face coverings, surgical masks, N95) and “Scholars who have meta-analyzed the primary data have mostly concluded that evidence of mask benefit is weak and that benefit is modest at best.” [38]
Implementing Lockdowns on a policy level across the whole country as a means to reduce transmission, mortality, and hospitalizations due to Sars-CoV-2 must be taken into great consideration for future pandemics. Evidently, it has been shown that the original SIRs model failed to accurately predict the mortality and hospitalization due to Sars-CoV-2 which led to the hasty decision of lockdowns. However, this does not mean we should abandon all models, but we need more innovation and creation of better models that can accurately predict the trajectory of new diseases and viruses during a pandemic with better information. As we can see, the evidence is also heavily supporting the fact that lockdowns play a small role in the combat against Sars-CoV-2.
Moreover, in the next part, we will finalize this piece by looking at the negative outcomes of lockdowns because government and health officials did not properly account for opportunity costs of such intervention. What kind of damage to the economy and livelihoods of people not only in Canada, but around the world, were at the cost of saving lives from Sars-CoV-2?
Stay Tune and stay healthy.
Exercise. Eat Healthier. Sleep better. Reduce Stress.
Kai Cheung
Comments